| Introduction |
|
In 1998 the Larsen-B iceshelf, on the eastern side of the Antarctic Pensinsular, lost a
large amount of ice. This happened again in March 2002 and numerous media reports declared that
the Antarctic was melting and that sea-levels would rise through-out the world.
|
| 1. Sea Surface Temperature |
| The image below shows the sea-surface temperature anomalies in March 2002
when the latest major loss of ice from the Larsen-B iceshelf occurred. (The temperature anomaly is the variation from the average temperature for that time of year, taken over an extended period which usually 1961-1990. It is purely a variation from the averages and should not be construed as a direct temperature measurement. For example, a temperature anomaly of -3 degrees at one point may be caused by the same physical temperature as an anomaly of +3 degrees at another; it all depends on the averages.) This image is from a web page "NOAA Optimum Interpolation Sea Surface Temperature Analysis" available here under the heading "Latest Plots and Plot Archives". You can monitor SST changes via this site and can obtain data and plots from the archives. |
 |
| The small patch of warming adjacent to
the Larsen-B iceshelf is circled. No other part of the Antarctic coastline shows
warming of more than 1.5 degrees above average. Some small
patches of coastline show slight warming (up to 1.5 C) but other
regions show either normal temperatures or slightly below.
It is clear that, at that time, there were NO grounds to believe that large areas of the Antarctic coastal ice were melting or would melt in the near future. PS. In August 2002, 5 months after the loss of ice from Larsen-B, NASA reported that between 1979 and 1999 the Antarctic sea-ice had been increasing in all areas except near the Antarctic Peninsular. (See here.) The increase in sea ice was about 5.6 million square kilometres but this was partly offset by a loss of 3 million square kilometres. So much for warming! |
| 2. Recent observations |
| The images below show the anomalies in sea-surface temperatures for the
southern hemisphere at intervals of two months for the period December 2003 to October 2004.
(The map legend is the same as above.) |
 October 2004 |
 August 2004 |
 June 2004 |
 April 2004 |
 February 2004 |
 December 2003 |
| Some very minor warming can be seen along
the west side of the Antarctic Peninsular (i.e. below South
America) in
February 2004 and December 2003 but there is no indication of any large scale
coastal warming. |
| 3. Historic Land-based Antarctic Temperatures |
| The graph below shows the average annual temperatures at four research
bases in the Antarctic. These bases are dispersed around the Antarctic coastline. Casey, Mawson and Faraday are spread between latitudes 65 and 67 south, with Halley at 75 south. Faraday is at
longitude 64 west; Halley is at 25.5 west; Mawson at 63 east and Casey at 111 east. Data for this graph comes from the web pages of the British Antarctic Survey, specifically the page here. (BAS regularly updates the data on its pages.) |
|
| Only the Faraday
Base,
near the Larsen-B ice-shelf, is showing signs of a gradual increase in
temperature (see blue line).
Temperatures in other regions are showing little long-term change. |
| 4. Lateral fractures in Larsen-B? |
| The Larsen-B ice-shelf did not melt away but disintegrated into a large
number of small icebergs. This suggests that the break-up was caused by one or more structural forces
within the ice. Some writers have suggested that the earth or rock which supported the land-most edge of the 220-metre thick iceshelf was somehow undercut and the weight of the ice then caused it to break free. This theory has not been proven or refuted but the break-up did take place in progressive fashion over about 5 weeks and it is difficult to understand why the undercutting would not lead to one very large fracture. British sources say that water accumulated in the crevasses in the ice and that as little as 6m of water can cause sufficient pressure to force a crevasse to open wider and extend down through the ice until a split occurs. (See here for more details and images.) They say that crevasses are lateral because movement in the glacial has caused flexing and cracking in a lateral direction. (more pictures). This crevasse-based fracturing depends largely on time and temperature. A small temperature increase would melt only a small amount of water which would then freeze again deep in a crevasse because of the surface temperature of the ice and the absence of sunlight. Large quantities of melt-water could exist if the temperature rise was sharp and sudden, or perhaps if a small temperature increase could be sustained. The former would be consistent with blast of warm wind rather than a general temperature increase. The latter relies on warm air to melt the ice and then deep within the crevasse, conditions warm enough to delay the freezing of the water long enough for pressure to build up. (This delaying doesn't only mean keeping the water in a liquid state. Ice has greater strength than water but even the strength of ice varies with temperature. Ice just below 0 degrees is far weaker than ice at lower temperatures.) Larsen-B fractured in March, at the end of the southern summer and when the Antarctic was no longer exposed to 24 hours of sunlight. Antarctic sunlight is never directly overhead and even wide fractures would need to be shallow if sunshine was to penetrate their depths. Air temperature alone does not appear to have been the cause of the fracturing of Larsen-B. |
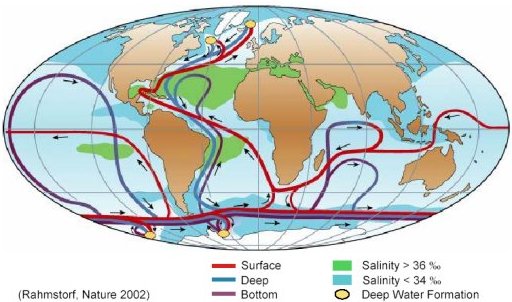
| 5. Thermohaline Circulation |
| Thermohaline circulation is the name given to the method by which oceans
circulate water around the globe. Warmer water moves from the tropics to the polar regions where the
heat is given up and the water sinks as it cools. This cold water, with high salt concentration, moves
from polar regions into warmer zones where it gains heat and up-wells to the surface, and thus starts
to repeat the cycle. The image below shows a recent refined proposal for thermohaline circulation paths. It, like the proposals that it supersedes, features a major junction and turning point to the east of the Antarctic Peninsular. |
 |
|
The width of the circulation paths is not known, so we cannot be certain that the Antarctic coast near
Larsen-B has not been affected by these natural water flows. |
| 6. Jet stream Winds |
| A ring of high-level jet stream winds circle the Antarctic and, like all
jet stream winds, these influence climate on the ground. These winds sometimes loop far from the pole
and sometimes are almost circular. (A deep loop in the Artic jet stream is believed to have been a
factor in Europe's high temperatures of summer 2003.) The first image below shows the Antarctic jet stream winds about the time of the loss of ice from the Larsen B ice shelf. Winds are very strong across the Antarctic Peninsular but more importantly, the winds are coming from quite a distance into the Pacific Ocean. (This image and many others can be found in the archive of the California Regional Weather Server, here. It was taken from an animated sequence which included the date shown.) |
 |
| The next image is from 12 months later
and shows very little looping - the stream line is almost
circular - and no jet
stream winds that draw air from above the Pacific Ocean. |
 |
|
These rising and falling of these upper level jet stream winds cause regions of high and low pressure at
ground level and the usual weather patterns that each of these bring. Variations in these winds,
especially the extent of looping could be a contributor to the break up of
the Larsen B iceshelf. |
| 7. Other Possible Causes |
| The Introduction to
"Antarctic
Peninsula Climate Variability: Historical and Paleoenvironmental Perspectives" edited by Domack,
Leventer, Burnett, Bindschadler, Convey, and Kirby (AGU, Antarctic Research Series, Volume 79) briefly
discusses the issues to be explored in the other chapters. It says that the precipitation, i.e. snowfall, on the western side of the peninsular is far greater than on the eastern side (where Larsen B ice shelf is found) but the western side is genrally warmer than the eastern. Further, the Larsen B ice shelf is quite thin compared to the shelves on the western side and is more susceptible to short-term increases in surface melt water. The western coastline has generally warmer water than the east because it is exposed to the circumpolar current but a number of currents meet near the eastern coastline and water temperatures vary. It has been recognised that warmer waters can undermelt the ice shelves in these areas but complicating matters are tides that are quite different on each side of the peninsular. Meteorological conditions have contributed to warming in recent times, especially winter warming of about 0.1 degrees C per year. The circumpolar trough of low pressure is a strong influence bringing mild northwesterly winds onto the west of the peninsular while the eastern side has colder winds from the Weddell Sea. The circumpolar trough appears to be influenced by the El Nino Southern Oscillation (ENSO) as well as oscillations based in the Atlantic Ocean. Complex? Certainly. But until these natural influences are better understood it will be impossible to determine whether humans are causing any climate change in this region. |
| 8. Summary |
| There is no indication of significant warming in the seas surrounding the
Antarctic nor on the land mass. Some warming is taking place in the region of the Antarctic Peninsular
but it appears to be very much isolated to that region and may be a consequence of thermohaline
circulation. Melting of Antarctic glaciers and ice shelves is certainly not indicated. POINT TO PONDER: If temperatures on the Antarctic Peninsular were unchanged as the rest of the continent warmed, would we pay much attention to that region? Would we try to claim that temperatures across the continent were not changing? |