Ice Cores
Introduction |
|
|
Ice cores from Greenland and from Vostok Base in the Antarctic
have provided data from which temperatures and air compositions
have been determined. These records go back more than
400,000 years and provide information about climatic conditions
through that period. As snow flakes land they loosely trap air and over a period of time the weight of snow above compresses lower levels to form ice. Air bubbles are trapped within the ice but this is air that has slowly permeated up through the snow and mixed with other air along the way. The air trapped in the ice is dated according to certain trace elements but in reality it is a mixture of air from an extended period of time and we are only looking at an average composition for all of that time. Here are some graphs of temperature, gas and the difference in age between the ice and the average air trapped within it. |
|
Greenland's Temperature (Arctic) |
|
Below is the graph of Greenland's temperature in the last 10,000 years.
The changes are probably very indicative of temperatures changes across all of the Northern Hemisphere.
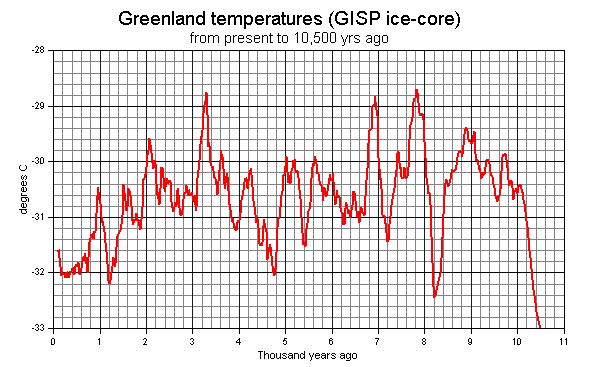 Temperatures from Greenland. About 1,000 years ago average temperatures were about 1 degree higher than today (which makes our concern about an 0.4 degree rise since 1980 rather minor). About 2,100 years ago average temperatures were about 2 degrees higher than today. About 3,300 years ago average temperatures were about 3 degrees higher than today. (The data from Greenland ice-cores goes back far beyond this time so, despite what some people say, it looks like it takes a lot more than 3 degrees to melt the ice cap!) The remains of woolly mammoths have been found on the northern edge of Siberia and dated at around 7,000 and 8,000 years ago (along with others from around 30,000 years ago). Mammoths are not likely to have hibernated nor migrated vast distances. They are also unlikely to have eaten frozen grass or tundra and so we can surmise that temperatures at that time were warm enough to produce adequate food all year round. That part of the world currently averages just above zero in one or two months of the year and in teh other months as much as 40 degrees below zero. Look at the increase in temperature about 3200 years ago. It is about 1 degree in less than 50 years. In the twentieth century temperatures have risen and fallen, the most recent change being an increase since 1980 of about 0.4 degrees. The maximum was reached in 1998 and while temperatures have fluctuated since then they have not exceeded that point. An increase of 1 degree in 50 years is looking very unlikely. For almost all of the last 8,000 years temperatures were higher than today. More precisely, apart from a brief period 1200 years ago, it is only the last 750 years that have been at or below current temperatures. |
|
Vostok Temperatures (Antarctic) |
|
Here's the temperature in the last 10,000 years according to the Antarctic ice cores
from Vostok Base.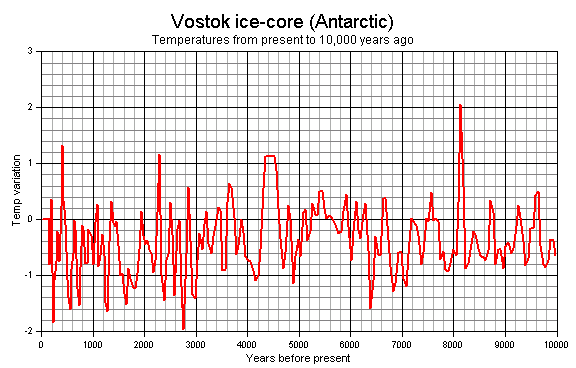
Antarctic Temperature The average over the last 10,000 years here is probably about 0.4 degrees and fluctuations have been in a narrow band. Far less is known about the Antarctic due to the absence of ancient settlements and the isolation of the continent (ie. the lack of any land-bridge to more hospitable regions). |
|
Comparison of Arctic and Antarctic Temperature |
|
Let's start with the last 5000 years and then take a look at a longer period.
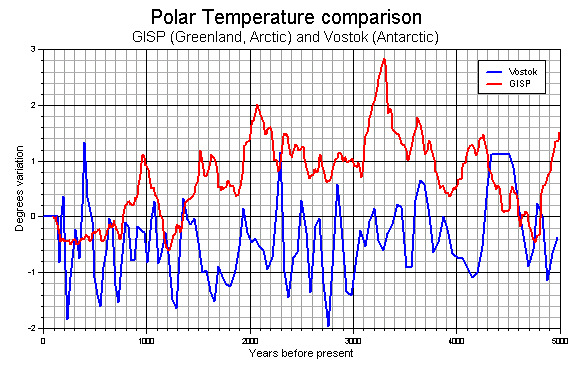 Last 5,000 years What can we say but the fact that the temperatures seem quite independent of each other! 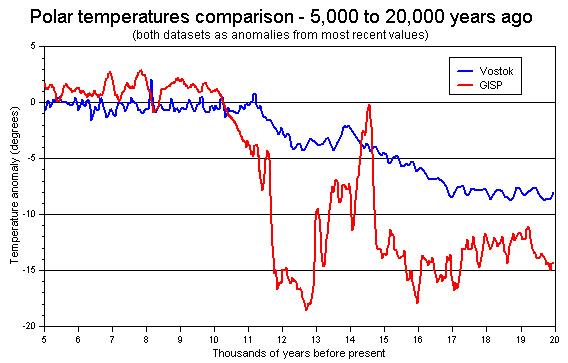 From 5,000 to 20,000 years ago The two sets of data in this graph has the same baseline as the previous graph. Data from Vostok was provided in degrees difference to current temperatures but each figure for Greenland was subtracted from the most recent temperature in the dataset in order to obtain the variation. The two interesting issues here are the difference in temperatures during the coolest periods and the peak in Greenland temperatures about 14,500 years ago when temperatures in the Antarctic appear to be stable. |
|
Vostok - Ice and Air |
|
Here's some graphs that illustrate the difference in age between ice and the air bubbles trapped
within that ice. The real questions are just how old is that air and whether the averaging
effect has lost vital information about (relatively) short periods of time.
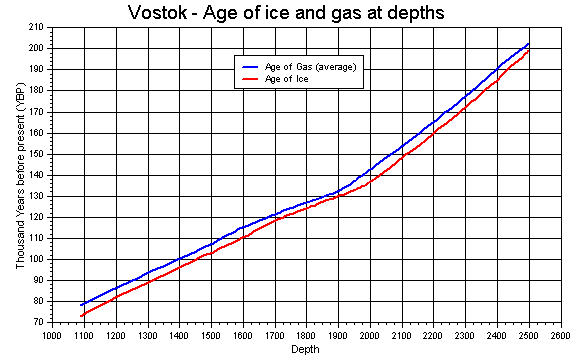
Ice and air ages at depths For example, at 2100m depth in the ice, the ice itself was about 148,000 years and the air trapped within the ice was about 154,000 years old. That age difference is 3 times the period since the times described in the new testament of the Bible! 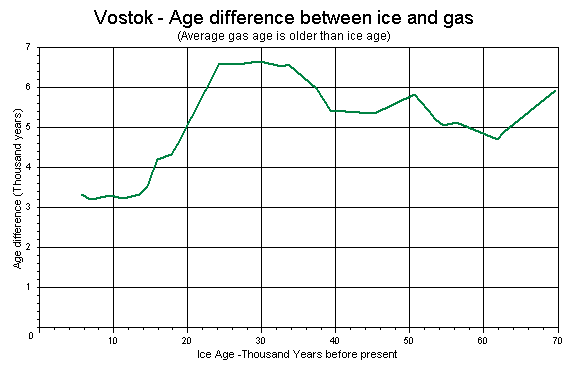
Difference in age between air and surrounding ice (1) This is the difference in age for the last 70,000 years. The minimum time difference is more than 3,000 years so we have no chance of observing short-term events. 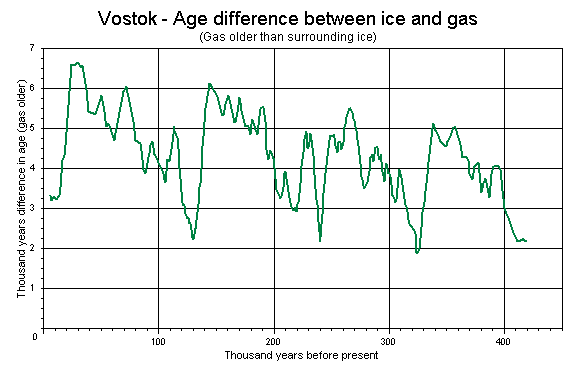
Difference in age between air and surrounding ice (2) Same graph but extended out to 400,000 years. Very little snow falls near the Vostok Base and the age difference between the ice and the air is quite substantial. 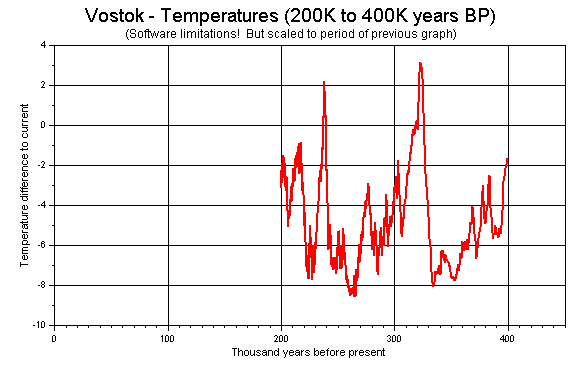
Temperature for the period 200,000 years ago to 400,000 A comparison of this graph and the previous shows that colder temperatures mean a greater difference between the age of the ice and the age of surrounding air. |
|
References |
|
| Greenland- Alley, R.B.. 2004. - GISP2 Ice Core Temperature and Accumulation Data. IGBP PAGES/World Data Center for Paleoclimatology Data Contribution Series #2004-013. NOAA/NGDC Paleoclimatology Program, Boulder CO, USA. (online at http://www1.ncdc.noaa.gov/pub/data/paleo/icecore/greenland/summit/gisp2/isotopes/gisp2_temp_accum_alley2000.txt) Vostok- Barnola,J.M; Raynaud, D; Lorius, C; Barkov, N. I. -"Historical CO2 Record from the Vostok Ice Core", January 2003 (online at http://cdiac.esd.ornl.gov/ftp/trends/co2/vostok.icecore.co2) Petit, J. R. et al - "Historical Isotopic Temperature Record from the Vostok Ice Core", January 2000, (online at http://cdiac.esd.ornl.gov/ftp/trends/temp/vostok/vostok.1999.temp.dat) |
|