Great Barrier Reef Sea Surface Temperatures
(Aug 2014)
In past years we have been told that the Great Barrier Reef (GBR) will
soon be bleached by rising temperatures and an Australian icon
will be lost.
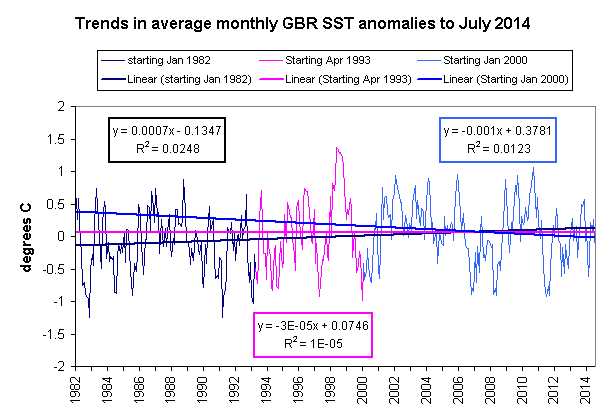
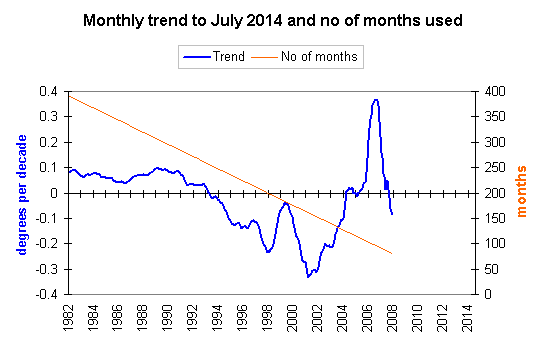
According to the five main global temperature datasets (HadCRUT4, GISS, NCDC, UAH or RSS) Global average temperature anomalies haven't risen for at least 15 years. So how fast are sea surface temperatures along the Great Barrier Reef rising? The short answer is that they are not. The longer answer is that they have fluctuated, as temperature anomalies do, but the long term trend is nothing to be alarmed about. Figure 1 (below) shows the anomaly in monthly average sea surface temperature for all of the Great Barrier Reef and Figure 2 shows the trends in the data from three periods that all end in July 2014.  Figure 1 - GBR Sea Surface Temperature anomalies from January 1982 to Jul 2014. For the technically minded, the data was extracted from the NOAA OI sea surface temperature datasets, the temperature for the same calendar month in each year was averaged and to calculate the anomaly the average for the month was subtracted from value in the same month in a given year. The Bureau of Meteorology also uses NOAA OI sea surface temperature data but its data for the Great Barrier Reef is the "Coral Sea" region, which stretches as far north as the northern coast of New Guinea and east to beyond New Caledonia. The eastern edge of the Coral Sea data is about 1200 km off the Queensland coast but the Great Barrier Reef extends to only about 120km.  Figure 2 - Temperature anomalies with trends for three different start dates and all ending in July 2014. The trends are shown in Figure 2 on a "per month" basis, so multiply by 12 to calculate the trend in degrees per year, then by 10 to obtain per-decade trends or by 100 to get per-century trends. The original data, which is at greater precision than shown here, results in the trend from January 1982 to July 2014 being 0.082C/decade, from April 1993 to July 2014 being 0.023C/decade and from January 2000 to July 2014 being -0.121C/decade (i.e. cooling of 0.121C/decade). Multiplying each of these by 10 to get the per-century trends results in warming of less than one degree in a hundred years for the first two and a cooling of 1.2 degrees per hundred years for the third. The SST trend starting in any month and ending in July 2014 can be calculated using a spreadsheet tool like Microsoft's Excel. The trends for each month and the number of months over which the trend was calculated are graphed in Figure 3 (below).  Figure 3 - Temperature trend to July 2014 from any start month, plus the number of months used to calculate the trend. Figure 3 shows that the trend starting in any month from March 1993 to December 2004, and ending in July 2014, is downwards (i.e. cooling). For example, the trend for the period from June 2001 to July 2014 is -0.316C/decade (i.e. a cooling of almost 3.2C over 100 years). This trend graph ends in 2008 because at that point less than 100 data values are being used to calculate the trend, compared to the 390 values that were used at the start of the graph (January 1982). Trends in data that varies as much as the sea surface temperature (See Figure 1) are unreliable and unhelpful when less than 100 data points are available because small changes can suggest large trends. From this data we can see that the trend from early 1993 - the month of March to be precise - to July 2014 has been flat. That's 21 years and 4 months over which temperatures have risen and fallen (which is why shorter trend periods show both warming and cooling) but with a flat total trend. Despite the claims made in the report mentioned above, sea surface temperatures are not on the rise (and obviously the claim that they will continue to rise is baseless), moreover the absence of an increase in temperature should have been evident when the report was written, which leaves the question of why the claim was ever made. |
||