Cloud Cover
|
|
These graphs use data from the ISCCP but Evan et al determined that the ISSCP D2 data is prone
to errors at the extremities of the vision of the various satellities (see Evan A. T., A. K. Heidinger, D. J. Vimont (2007),
"Arguments against a physical long-term trend in global ISCCP cloud
amounts", Geophys. Res. Lett., 34, L04701, doi:10.1029/2006GL028083.).
This paper includes a regression map (see below) but as Dr William Rossow of the ISCCP team has said, the paper lacks numerical details
in its description of the analysis technique.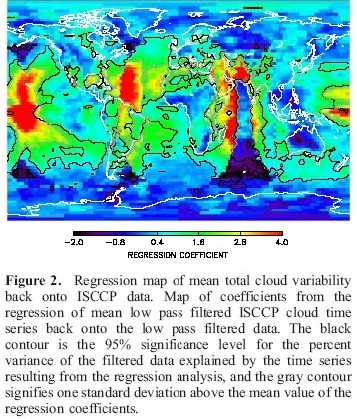 On the other hand, at least the data some regions corresponds well with observations. The Australian Bureau of Meteorology recorded cloud cover data from 1958 until 1998 when I suspect automated weather stations took over and they could not record sky cover. The figure below is a reduced version of that originally found at http://www.bom.gov.au/climate/change/cloud.shtml and it might still be there if they haven't removed the page.  Data values were scaled from the original graph and below it is combined with the average total cloud from the ISCCP dataset for the region latitude 115E to 150E and longitude 15S to 35S, which is about 95% of mainland Australia.  In the case the match between the manual observations and the satellite based measurements from the ISCCP are generally quite good, especially when the manual observations were probably at one of 9:00am and 3:00pm and sometimes both. The global average surface temperatures calculated from the D2 dataset also look suspect because the 12-month running average appears to vary by almost 4 degrees between 1989 and 2002 (see below). This variation is at least 10 times greater than the global average from the usual agencies and from the MSU-based measurements by UAH, moreover it appears to correspond to a northern hemisphere seasonal cycle, and unlike the data from other sources the impact of the 1998 El Nino is very minor.  The graphs presented here should be viewed with some caution because while there is no graph that concentrates on the area of greatest regression (see map above), there is the question of whether sensors functioned correctly. One would assume that if an error exists then it is likely to be relatively constant throughout the entire period of operation and would produce a relatively constant trend rather than short term variations. (I contacted the ISCCP team on 25 June and this note will be updated when I receive a reply.) |
|